Police cars mounted with automatic license plate readers (ALPRs) wind their way through the streets of Oakland like a “Snake” game on an old cell phone. Instead of eating up pixels of food, these cameras gobble down thousands of license plates each day. And instead of growing a longer tail, ALPRs feed into a giant database of locational data as they conduct surveillance on every driver within the city limits, and sometimes beyond.
This is the portrait that emerged when EFF analyzed eight days of ALPR data provided by the City of Oakland in response to a request under the California Public Records Act.
As cities and counties across the country pursue new law enforcement technologies, EFF is on a mission to use transparency as a counterbalance to mass surveillance. Since May 2013, EFF and the ACLU of Southern California have been engaged in a legal battle with two Los Angeles law enforcement agencies who are refusing to hand over a week’s worth of ALPR data. San Diego County, another jurisdiction, has similarly fought efforts by citizens to obtain access to data that law enforcement has collected on them using ALPRs. Both claim that the records are exempted under the California Public Records Act because they are records of law enforcement investigations. The agencies also argue the public interest in maintaining secrecy in ALPR data outweighs the public interest in learning how and where ALPR systems are being used.
The rub here is that law enforcement agencies like those in LA, San Diego, and Oakland aren’t using ALPR for targeted investigations, but rather running a dragnet on all drivers in their jurisdictions. As states across the country become more and more concerned about ALPRs and take steps to limit their use, we believe the disclosure of a limited amount of license plate records will help to inform public debate on this mass surveillance tool.
Events in other jurisdictions support our position. After Muckrock and the Boston Globe obtained Boston Police ALPR data, the city suspended the program in the wake of the privacy concerns raised by the data. When the Minneapolis Star-Tribune obtained ALPR data that it used to track the whereabouts of the mayor, it kicked off debate in the legislature about how to balance the privacy of innocent drivers against the ability of police to fight crime. As a Minneapolis city official noted at a public hearing on ALPRs after the data release, “now that we see someone’s patterns in a graphic on a map in a newspaper, you realize that person really does have a right to be secure from people who might be trying to stalk them or follow them or interfere with them.” A state legislator and former police chief noted at that same hearing, “even though technology is great and it helps catch the bad guys, I don’t want the good guys being kept in a database.”
Not all California law enforcement agencies have followed Los Angeles and San Diego’s lead in ALPR secrecy. Whereas Los Angeles cops have stalled for more than two years, Oakland provided raw ALPR data in just under two months.

With more than 63,000 data points, it’s a lot of information to process. We dug into the Oakland data to show many of the ways ALPR can be broken down and visualized to help ensure police accountability. It immediately became clear that with just a few ALPR vehicles—as few as two cars—Oakland is able to capture plate data from across the city, with a particular focus on lower income neighborhoods. The data also shows that police cars pick up license plates when making the journey to county jail (that's the long tail extending to the east). The data does not seem to indicate that Oakland has any ALPR cameras mounted in fixed locations.
Today we’re releasing the data to the public, with the individual license plate numbers removed to protect the privacy of drivers captured by these cameras. (While LAPD and LASD also claim the public’s right to privacy as a reason for withholding the records, the data can be anonymized easily with a few clicks, either by deleting a column for the spreadsheet or replacing the plates with random numbers.) We've also done some preliminary analysis of the data, which we present below. (If you just want the raw data, the links are at the end of the post.)
The Numbers
63,272
Total number of data points collected by Oakland Police ALPR cameras
48,717
Number of unique individual plates captured by Oakland Police ALPR cameras
39,274
Number of vehicles that were captured only once
4,571
Number of ALPR reads within one mile of Oakland Police headquarters
589
Number of captured plates that were likely assigned to government vehicles (i.e. police cars, buses, county vehicles, etc., which generally receive plates that are seven numeric digits)
150
Number of entries that were obvious bad reads (e.g. the cameras picked up road signs such as “CAUTION” or the plate had more than seven digits)
24
Number of times the single most-captured plate was hit (a government vehicle, likely a police vehicle, captured multiple times at the same locations over a short period of time)
1.3
Average number of times an individual plate was captured
ALPR by the Hour
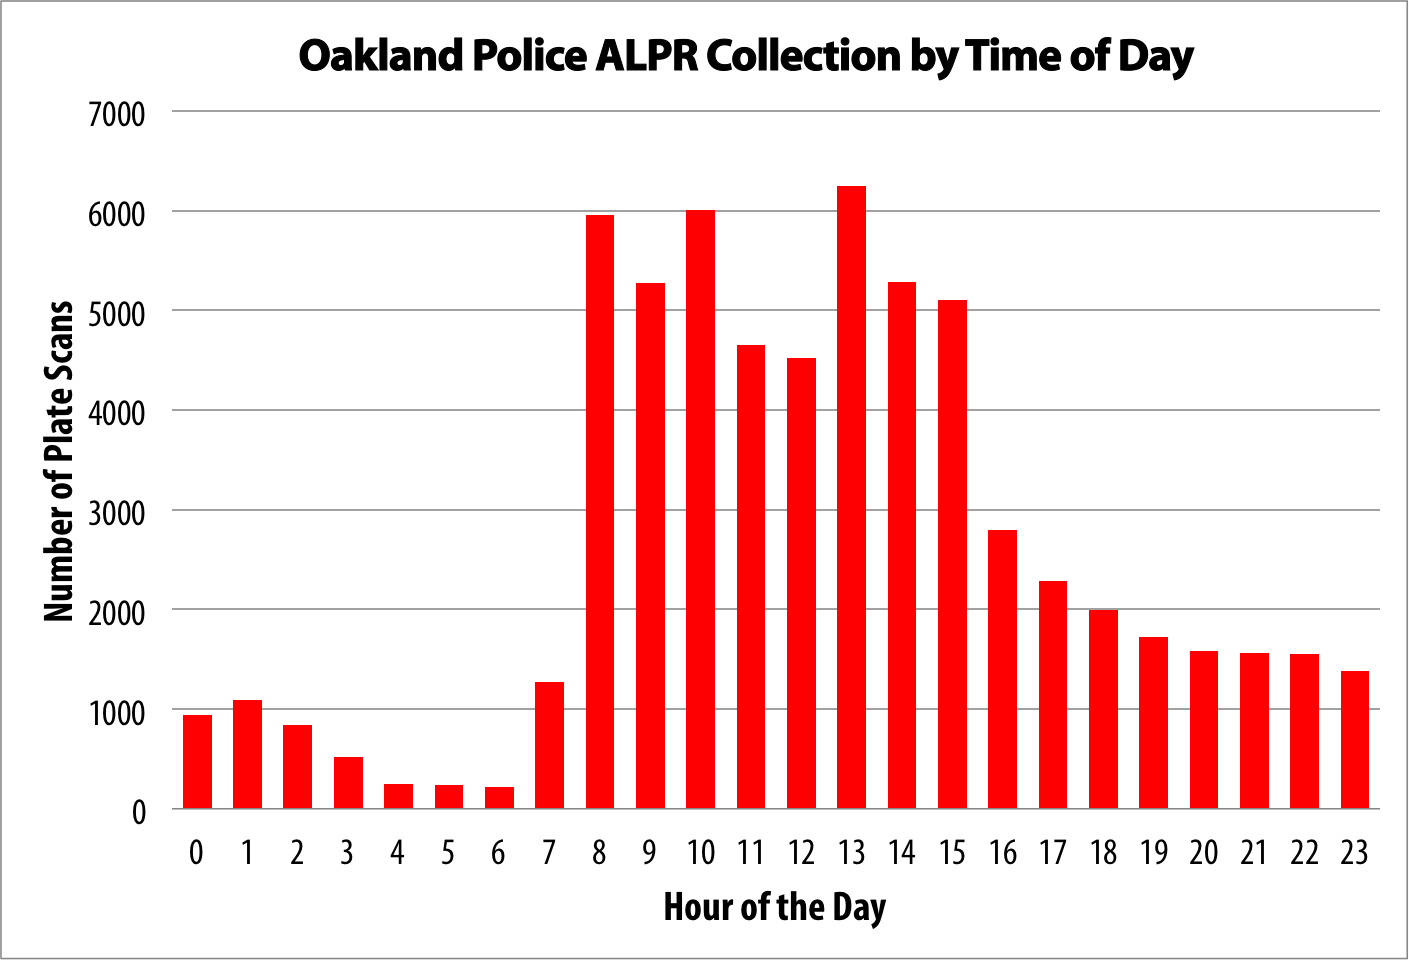
The data indicates that Oakland’s ALPR program may mirror the normal workday, picking up like clockwork around 8 am, waning slightly at lunchtime, then picking up again in the afternoon. Plate captures dropped off significantly during the overnight shifts, with ALPR vehicles mostly going dark between 4 am and 7 am.
ALPR by Frequency
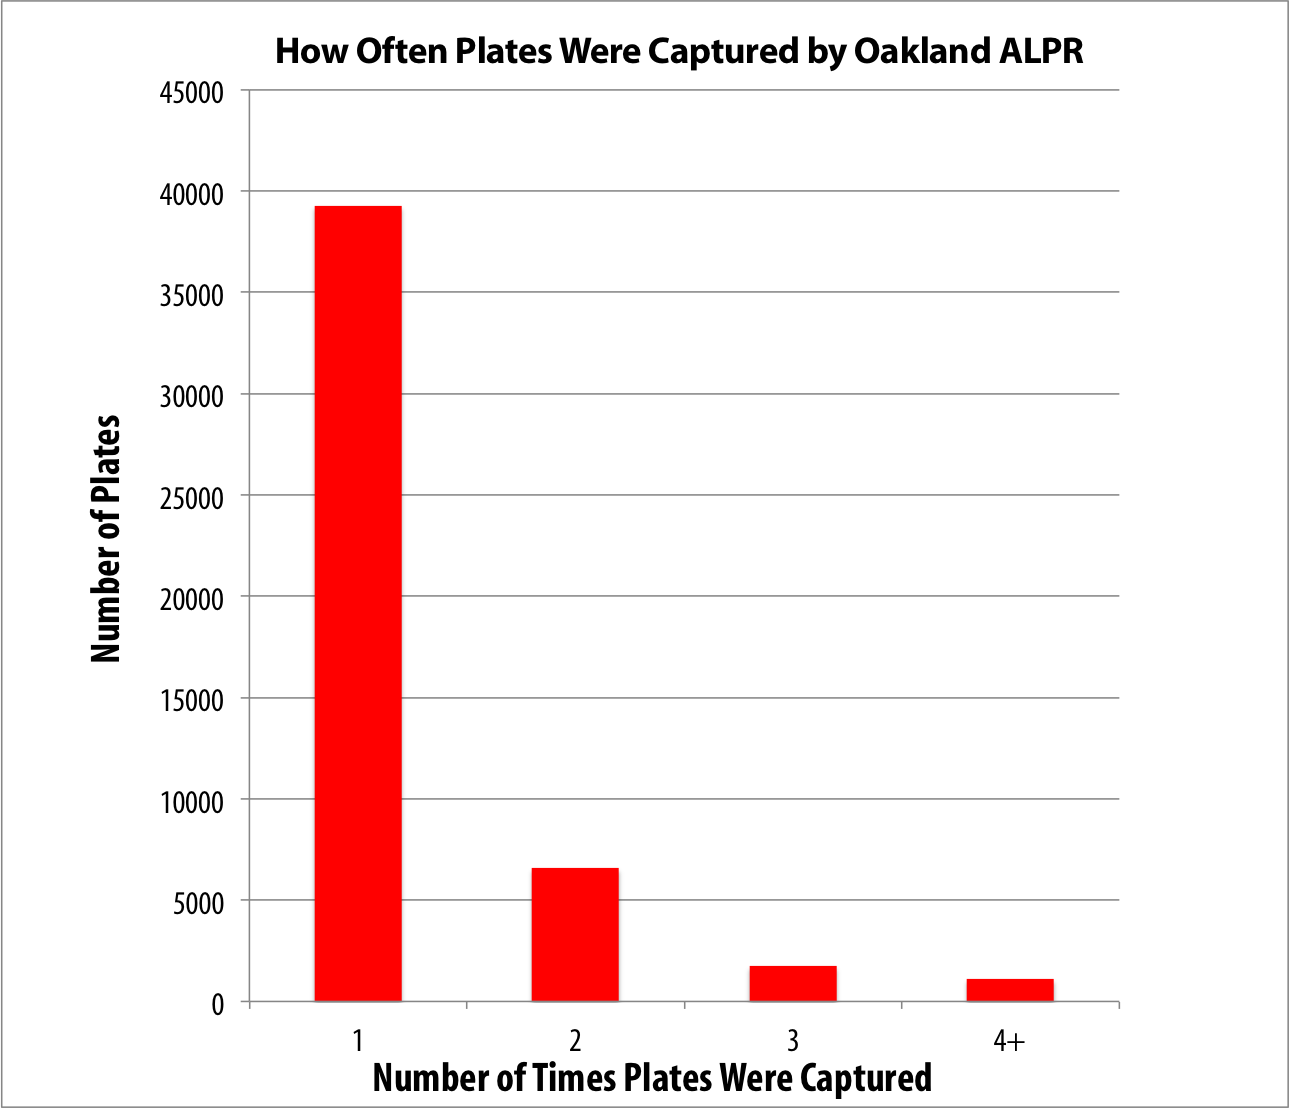
This chart shows how frequently individual plates were captured multiple times. The vast majority of plates were seen only once.
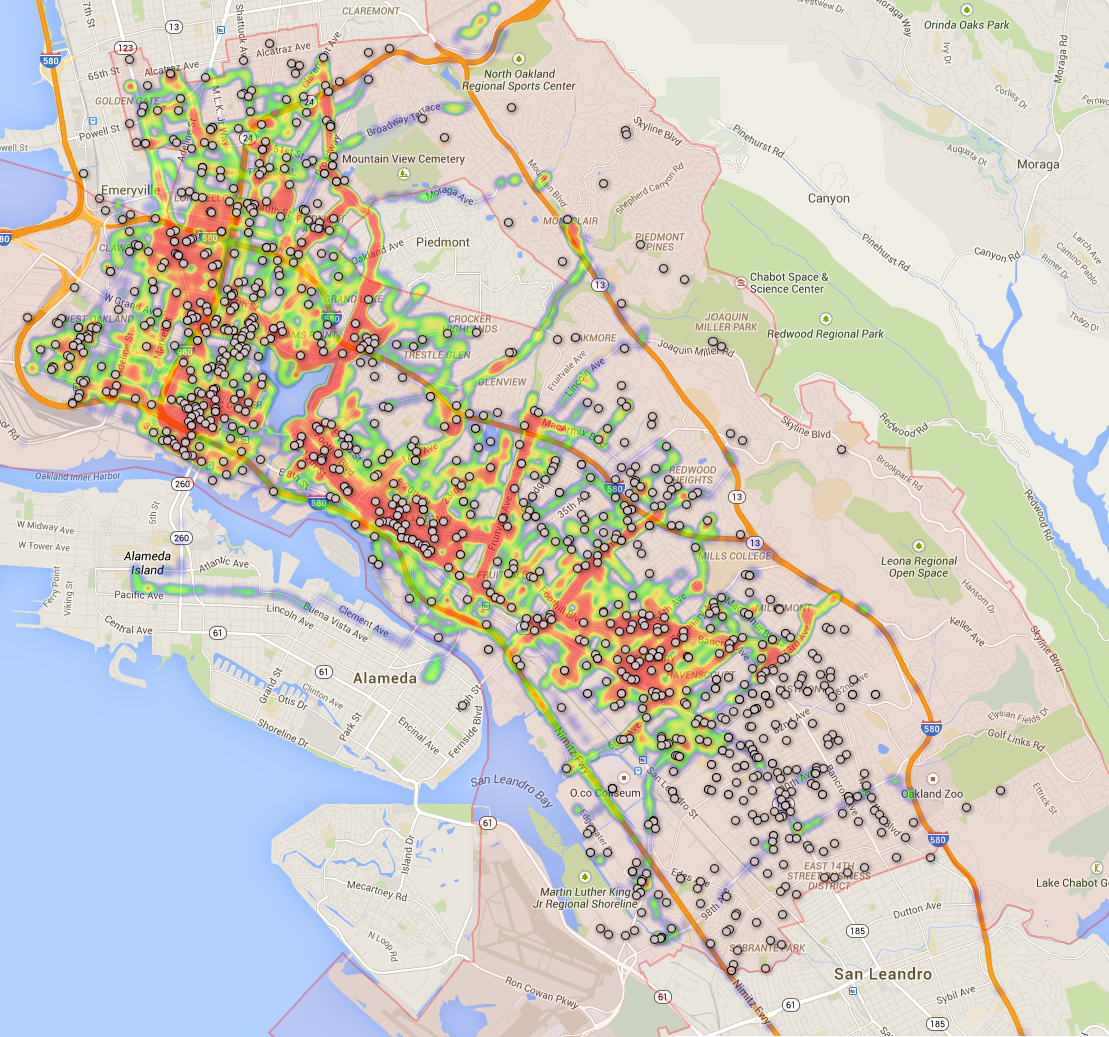
Heat Maps
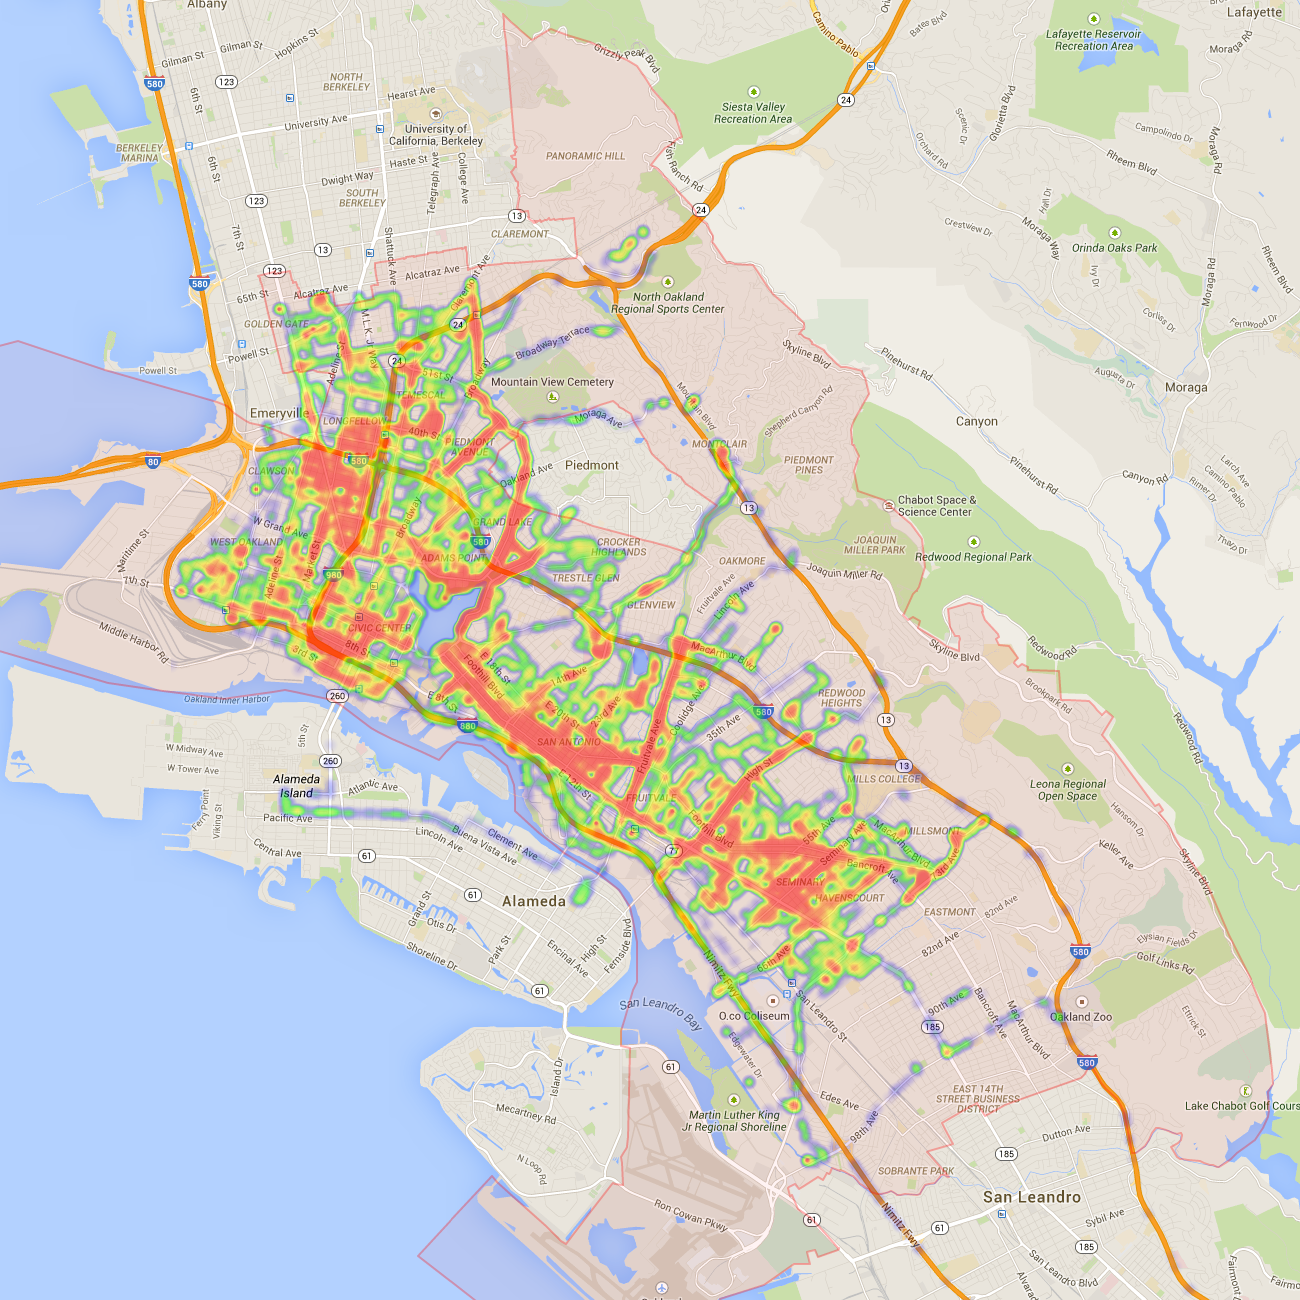
Click to enlarge. The shaded area shows the boundary of the City of Oakland.
Your plate is more likely to be caught on camera in a few specific locations. For example:
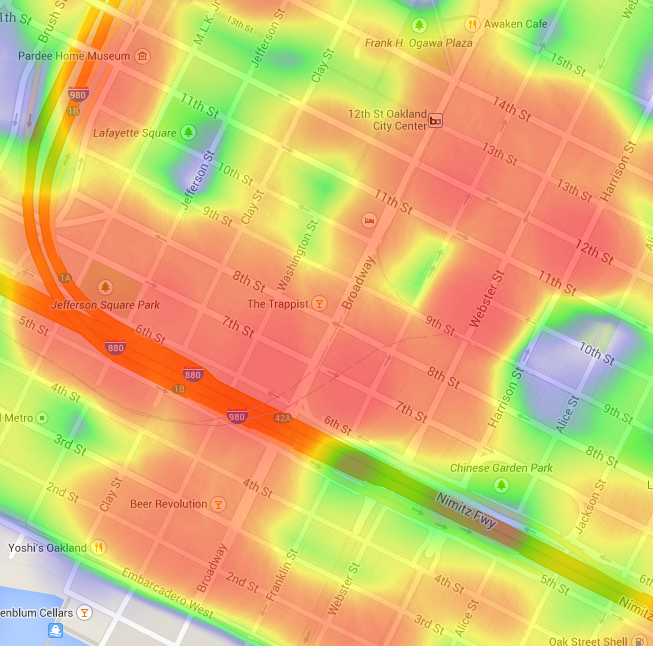
Downtown: Oakland PD headquarters is located near the corner of 7th St. and Broadway, so the increased number of hits in this area are likely due to patrol cars traveling to and from police headquarters.

Northwest Oakland: Have a car in northwest Oakland? Prepare to be scanned and recorded.
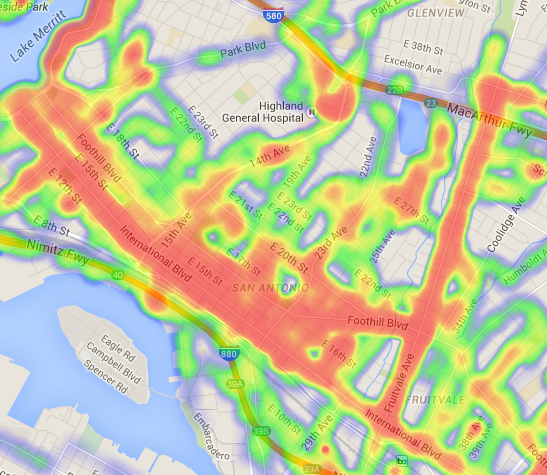
International Blvd. and Fruitvale: The same holds true for International Blvd. and Fruitvale Ave. (though some neighboring areas don’t seem to be targeted at all).
Surveillance and the Census
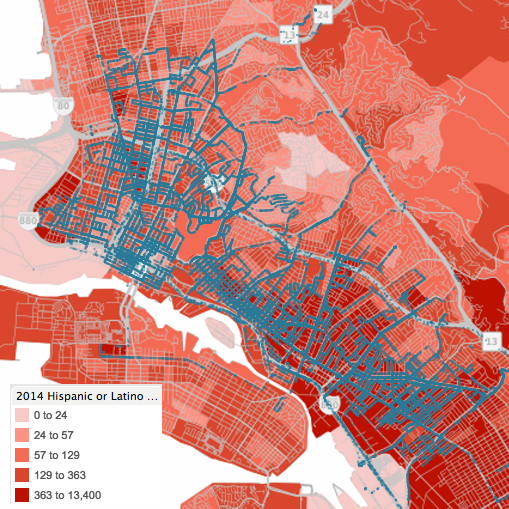
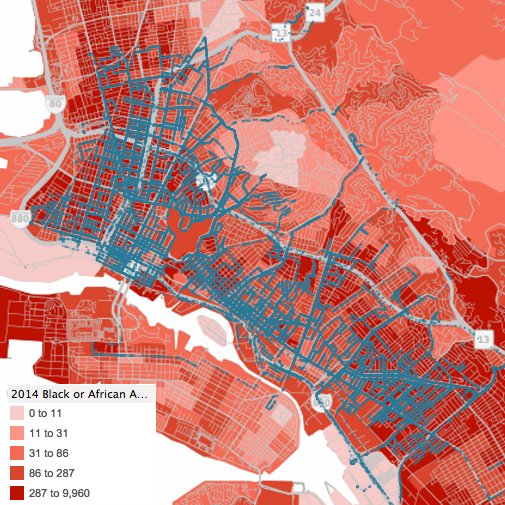
Using Tableau Public mapping software, we mapped the ALPR data over various layers of data from the U.S. Census Bureau. In each of these images, the darker the color, the higher the intensity.
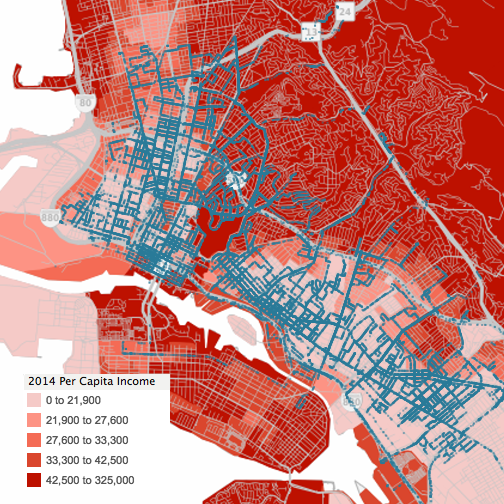
Per Capita Income: The data indicates lower-income neighborhoods are disproportionately captured by ALPR patrols, with police vehicles creating a grid of license plates in the city's poorest neighborhoods.
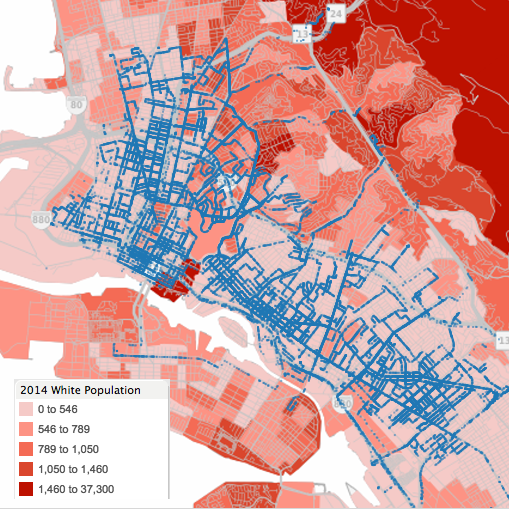
White Population: Perhaps unsurprisingly, the per-capita data and the white population data significantly overlaps. If you are driving through or parking your car in a neighborhood with a higher density of white families, you are less likely to be picked up by ALPR cameras, particularly northwest of State Highway 13.
Click images to enlarge.
Black and Hispanic Populations: Overlaying Census data for Black or African-American and Latinx or Hispanic populations shows the converse of the white population.
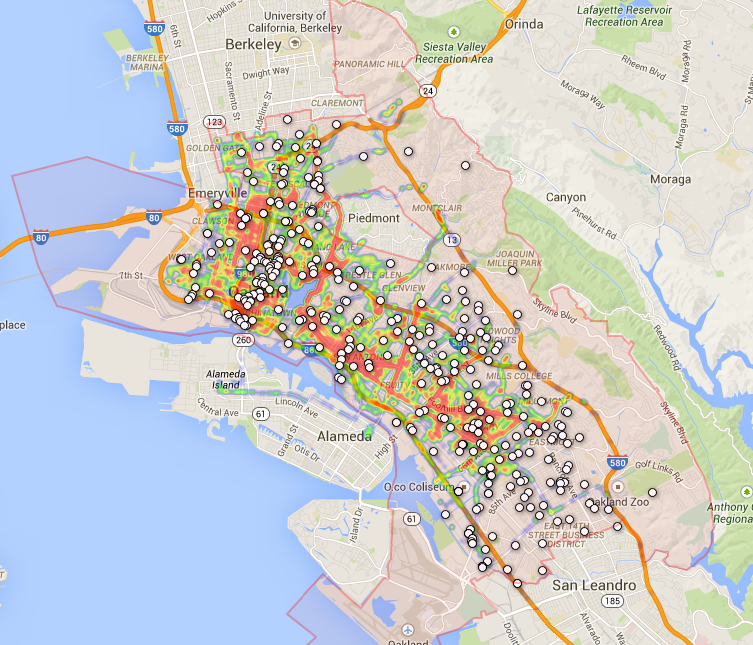
ALPR Data vs. Crime Data
We also filed a California Public Records Act request to obtain the Oakland Police Department's crime data for the same period. Each white dot here indicates a recorded crime. It's not much of a shocker that ALPR use doesn’t correlate very well with crime. For example, OPD did not use ALPR surveillance in the southeast part of Oakland nearly as much as in the north, west, and central parts of Oakland, even though there seems to be just as much crime.
To see if perhaps OPD was just focusing its ALPR use in areas with high incidents of automobile-related crime, we decided to map only the auto-related crime:
The result is the same—ALPRs are clearly not being used to deter automobile-related crimes.
ALPR and Mosques
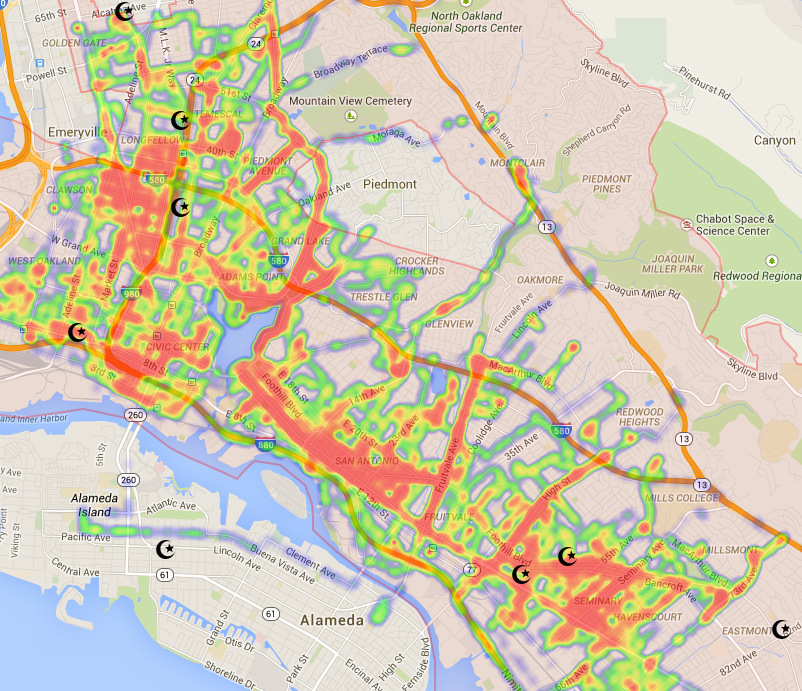
In filing requests for ALPR data, we chose one week of the Islamic holy month of Ramadan to see whether police were using ALPRs to gather intelligence on Muslim populations. When we plotted out mosques on the map, we discovered several were near ALPR hotspots, but there was little in the data to indicate that any particular focus was placed on these places of worship. Future inquiries worth looking into might include gun shops, medical marijuana collectives, abortion clinics, and protests.
ALPR Anomalies
Oaklanders aren't the only citizens who should be worried about OPD surveillance. The ALPR data we received also contained instances of ALPR collection outside Oakland's city limits.
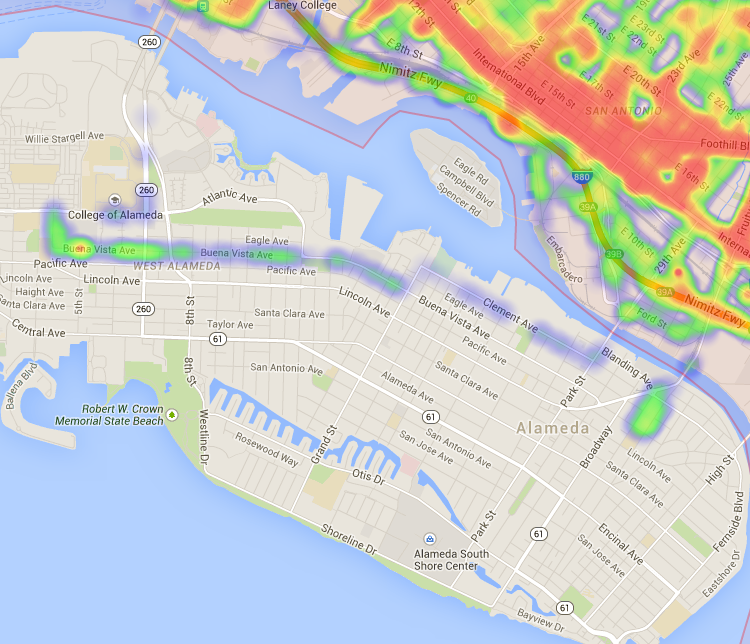
City of Alameda: Alameda is the island to the bottom of the map, and is an independent city. Apparently at least one officer decided to go spy on its citizens.
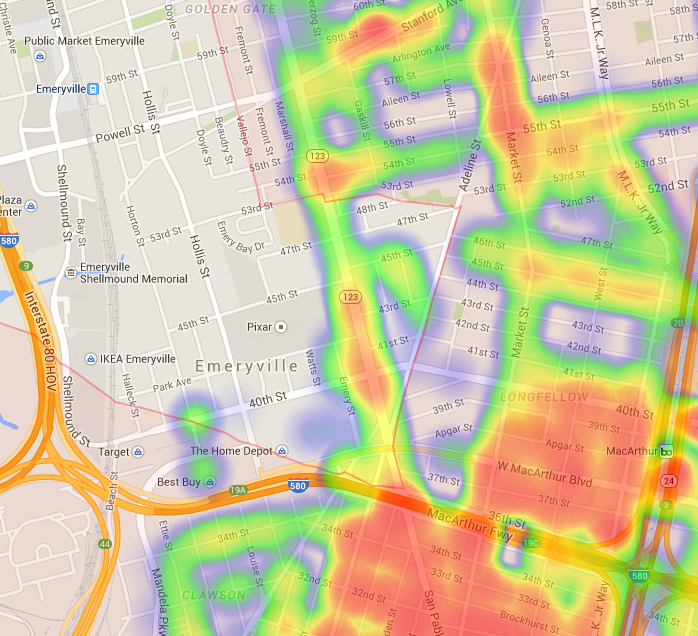
Emeryville: Emeryville is a city that borders Oakland, and is the portion of the map outside the light-pink shaded area. Obviously Oakland PD doesn’t think twice about surveilling its citizens when they cut across it.

Piedmont: Piedmont (the central unshaded area) is actually bordered on all sides by Oakland. As with Emeryville, apparently Oakland PD has not been directed to turn off their ALPR surveillance devices when they take shortcuts across other jurisdictions.
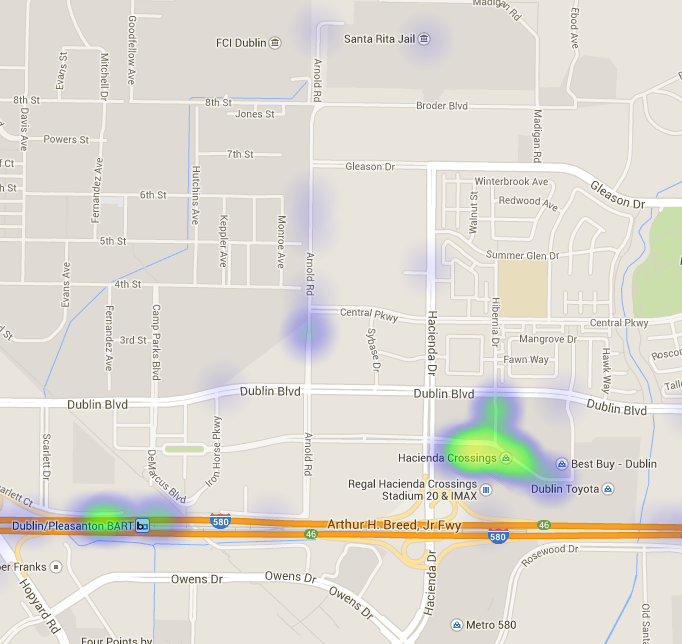
Mall Parking Lot: Apparently an Oakland PD officer left his ALPR on while taking a trip outside the city (likely to or from the Santa Rita jail) and stopped at the Hacienda Crossings Mall in Dublin, nearly 20 miles away from Oakland.
False Positives
ALPRs aren't foolproof. For example, California currently limits vanity plates to seven characters, but many plates with eight characters showed up in the data, including "CROSSWAL," "ROSSWALK," "ROSSINGS," "CAUTIC1N," "CAUTICJN," and "DRIVEWAY." Obviously none of these were actual license plates—in fact, 96 of the entries in the data were simply not possible due to being eight or more characters long. Instead, they were likely read (or misread) from traffic signs.
We also found other likely misreads from signs, including "PLUMBING," "AHEAD," "PRIVATE," "PARKING," "PARKIMG," "ALLOWED," "ORTOWED," "DORTOWED," "ONLEFT," "CAUTON," "CAUT10N," and four more variations of "CROSSWALK" as well as "ONE WAY." All told, there were 76 entries that were likely misreads from road signs (22 of which were over-length).
In another 95 instances, ALPR cameras captured the license plates, but failed to record any geographic coordinates. Plotted out on a map, it looked like Oakland police were patrolling the ocean off the coast of Africa.
Don't Take Our Word for It
Want to take a look at the data yourself? Do you have a better analysis method? Want to draw your own conclusions? Please do! You can find the ALPR data here and the crime data here, both in CSV format, or here in a Google Fusion Table.
Special thanks goes to Ari Isaak of Evari GIS Consulting for his help managing the data. All heatmaps were created using the awesome open source heatmap.js project on top of Google Maps.
Updated 1/22/2015: After publication of this post, we found a couple of off-by-one errors in our analysis. A manual inspection also found many more likely misreads from road signs, increasing the number from 134 to 150. The post was updated to reflect the correct numbers. We have also made small adjustments to the text for clarity that did not affect the facts of the post.