
Part of our strategy with this public records campaign was to seek two separate, uniform classes of documents easily exportable through Vigilant Solutions’ LEARN system. We provided each agency with a guide to producing these records straight from the user manual, which had been obtained through open records law by Mike Katz-Lacabe of the Center for Human Rights and Privacy. Most agencies were able to follow these instructions and provide the standardized records. Some did not and require a little work to decipher.
For the purpose of this guide, we will only explain the standardized documents.
Data Sharing Reports
The Data Sharing Report is composed of four distinct sections:
1) Who the agency is sharing with;
2) Who is sharing data with the agency,
3) Who the agency is sharing hot lists with, and
4) Who is sharing hot lists with the agency.
The first section is called “Detections Shared” and generally looks like this.
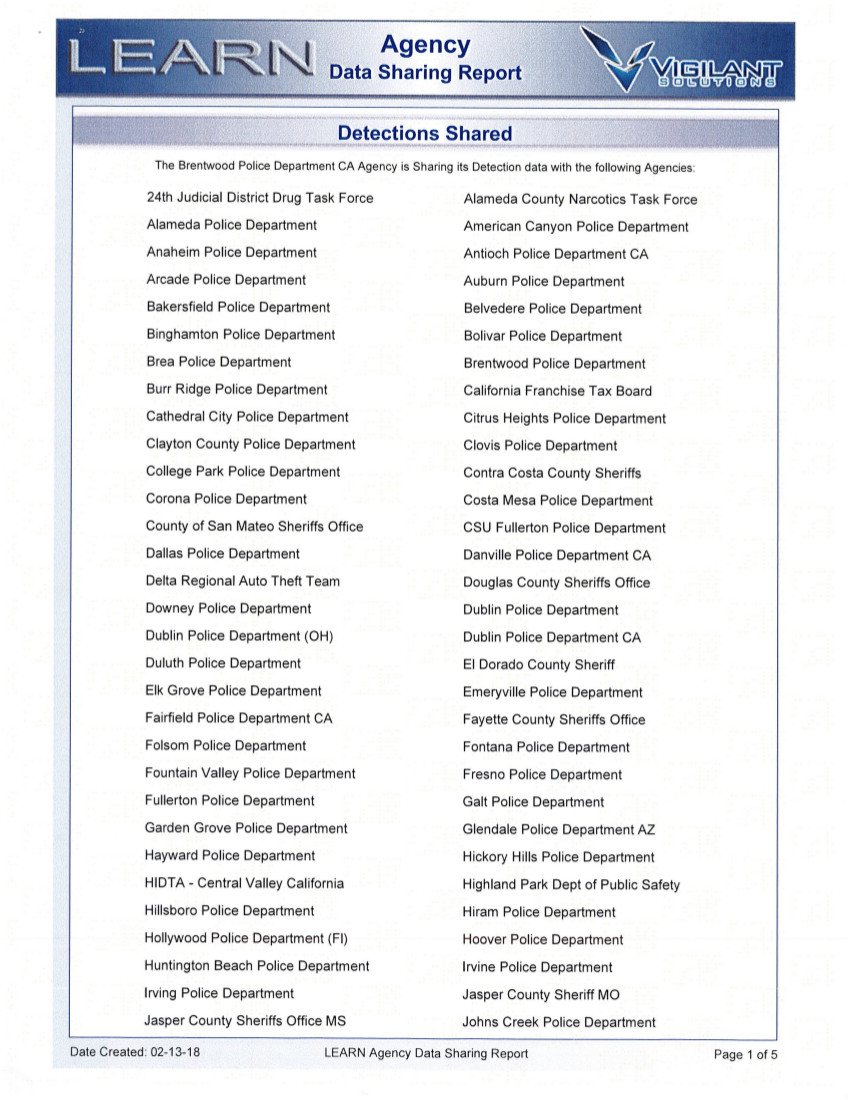
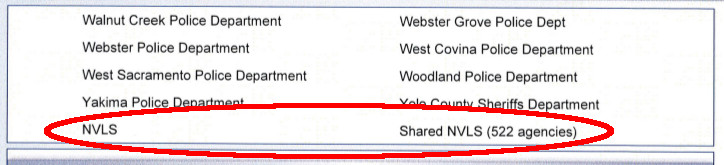
At the very bottom of this section, you will find whether the agency shares its data with NVLS (identified as NVLS and Shared NVLS).
This is followed by the “Detections Received” section, which shows which agencies’ data the department can access.
The last sections of the document show how hot lists are shared. You’ll note in the document below that Brentwood does not share its hot lists with other agencies; however, it does allow other agency’s hot lists to be compared against its data (in this example, Anaheim Police Department and the Montgomery Police Department’s hot lists).
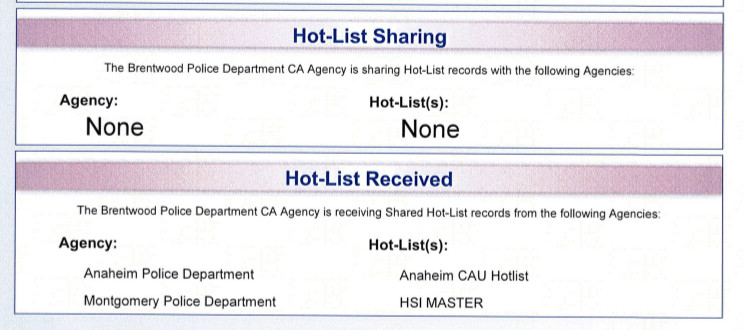
An important element to note is that while the previous sections of the document are split into two columns of agencies, the hot lists are formatted differently. The information on the left is the name of the agency, whereas the information on the right is the name of the hot list.
Hit Ratio Reports
The Hit Ratio Report shows how many license plates an agency scanned and how many of those plates were attached to a hot list. It generally includes a pie chart that highlights how few of the license plates that are collected have actually been flagged for scrutiny.
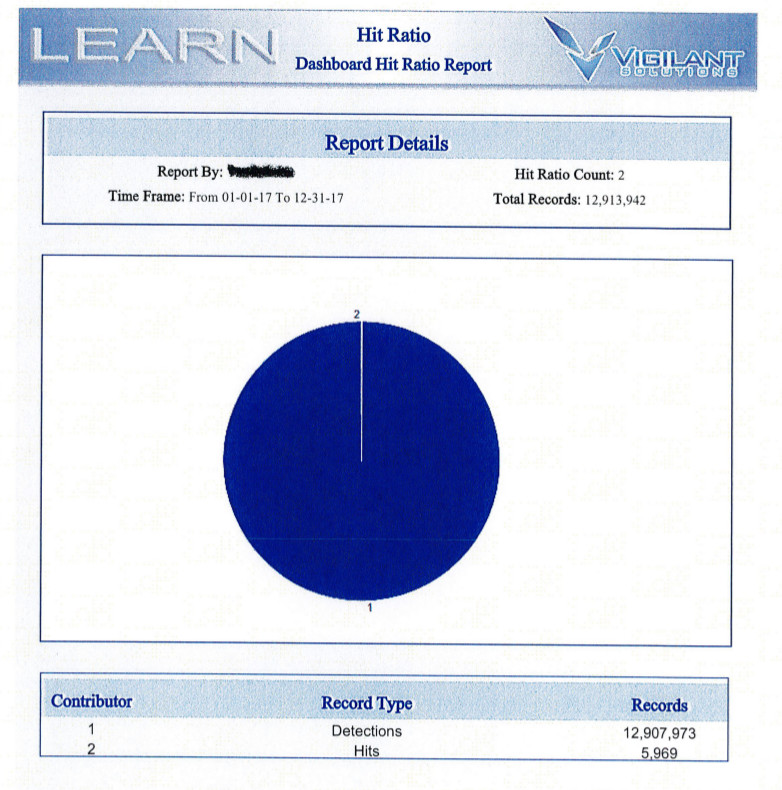
To determine a percentage, divide the number of hits by the number of detections, then multiply by 100. For example, the above Brentwood Police Department document shows that only 0.1% of the license plates captured were relevant to an investigation at the time the license plate was scanned.
As you peruse the records, you will notice that the data is often presented in other formats. Sometimes the detections and hits are in separate document. In other cases, the agency simply provided the numbers in an email.